Why Compare Stone Material Costs A Global Buyers Guide?

Time:2026-10-18 Author:Amelia
0%

Why compare stone material costs across borders? A low quarry price can become expensive after processing, packaging, insurance, and delivery. Buyers need more than a simple price list. They need a clear view of the complete supply chain.

The Stone Material Cost Comparison Guide examines quarry location, stone grade, block yield, slab thickness, surface finish, fabrication, and installation. It also considers freight distance, container capacity, currency changes, waste rates, and local labor. These details shape the final project budget. A marble slab priced at $45 per square meter may require more finishing than a granite slab priced at $55. The cheaper option may not remain cheaper.

Small details matter.

Architectural and materials critic John Ruskin wrote, “When we build, let us think that we build forever.” His words remain useful for global stone buyers. A material decision affects appearance, maintenance, replacement needs, and long-term value. Cost alone cannot measure that value.

This guide is designed for importers, architects, contractors, developers, and procurement teams. It encourages documented quotations, comparable specifications, and direct supplier questions. Ask about quarry capacity, quality consistency, lead times, packing standards, and sample approval. Request the same information from every supplier. Otherwise, comparisons become misleading.

Even experienced buyers can miss hidden costs. I have seen budgets change after freight surcharges, broken pieces, or unsuitable finishes appeared. That weakness deserves attention. No guide removes every uncertainty. However, a structured comparison makes risks easier to identify, explain, and manage before the order is confirmed.
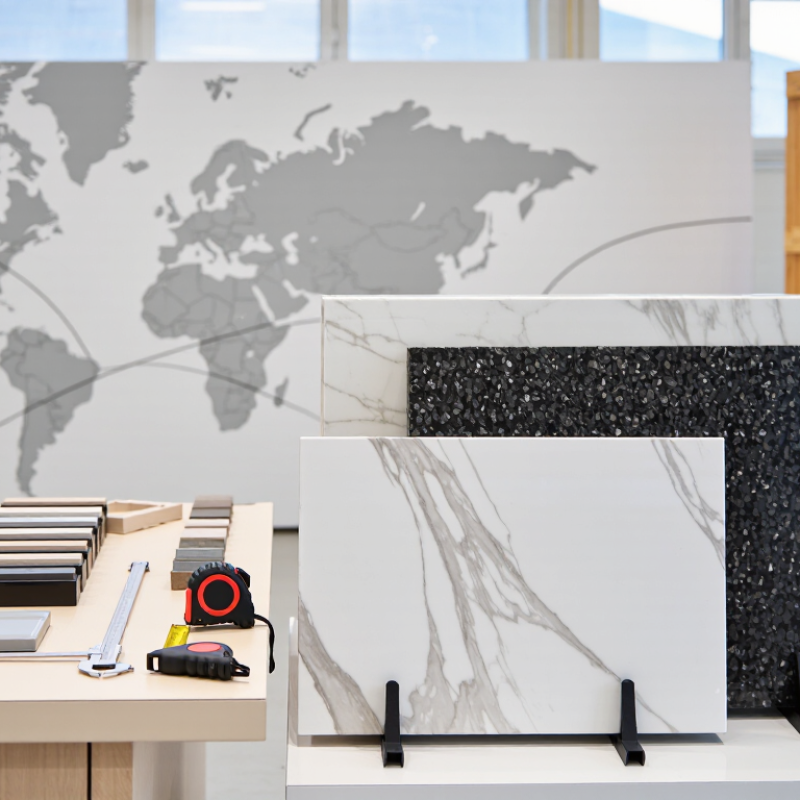
Why Compare Stone Material Costs A Global Buyers Guide?

Define Delivered Cost per m² for 20–30 mm Stone Slabs

Comparing stone material costs globally starts with one practical measure: delivered cost per square metre. For 20–30 mm slabs, the purchase price is only one part of the calculation. A reliable estimate includes quarry or factory pricing, cutting, crating, inland transport, export handling, freight, insurance, import charges, and destination delivery.

Use this formula: delivered cost per m² equals total delivered cost divided by sellable slab area.

A 2.0 × 3.0 metre slab provides 6 m² before cutting. However, edge trimming, vein matching, sink cut-outs, and breakage reduce the usable area. If only 5.2 m² reaches fabrication, dividing by 6 m² produces a misleadingly low figure. The calculation must follow the project’s real yield.

Thickness also changes handling requirements. A 30 mm slab may need stronger crates, additional lifting equipment, and higher transport charges than a 20 mm slab. Ask whether the quotation includes port storage, customs clearance, taxes, and final-mile unloading. These details often appear later. Too late.

From project cost reviews, I have found that the cheapest ex-works offer is rarely the lowest delivered option. Compare identical grades, dimensions, thicknesses, finish standards, and inspection terms.

Request weight data and packing measurements before booking freight. Keep written records of moisture, surface defects, and accepted tolerances.

One weakness remains: estimated breakage is never perfectly predictable. A cautious buyer should model a small contingency rather than present false precision.

Classify Stone with ASTM C97, C170, and EN 1469 Performance Data

Why Compare Stone Material Costs A Global Buyers Guide?

Stone prices become meaningful only after performance is classified. ASTM C97 measures water absorption and bulk specific gravity. ASTM C170 measures compressive strength, usually reported in megapascals. These results reveal how a stone may behave under moisture, weight, and handling stress. Low absorption can support exterior use. It does not guarantee durability.

EN 1469 evaluates natural stone slabs for cladding applications. It requires declared characteristics, including dimensions, tolerances, and relevant mechanical performance. Buyers should compare the declared value, test method, and specimen direction. A granite slab showing 120 MPa compressive strength is not automatically safer than one showing 90 MPa. Design loads, thickness, anchoring, and climate still matter. Context changes the decision.

The U.S. Geological Survey’s Mineral Commodity Summaries reports dimension stone production and trade separately from crushed stone. That distinction helps buyers read supply data more accurately. ASTM and European test results also support clearer procurement records across borders. Ask for recent laboratory reports, not only a quarry datasheet. Check absorption percentages, strength values, sample age, and testing conditions. Laboratory results are not the whole building. Field workmanship can still undermine excellent stone. Some comparisons remain imperfect, and buyers should admit that uncertainty before selecting the lowest quoted cost.

Why Compare Stone Material Costs? A Global Buyers Guide

Representative natural-stone performance data for global material screening. ASTM C97 covers absorption and density, ASTM C170 covers compressive strength, and EN 1469 supports the evaluation of natural-stone slabs for cladding. Actual results vary by quarry, finish, thickness, and test specimen.

Lower water absorption can reduce moisture-related risk, while higher compressive strength may support demanding applications. Compare project-specific test reports before linking performance to total installed cost.

Compare Quarry, Fabrication, Finishing, Freight, and Installation Costs

Stone pricing begins at the quarry, but the first quote rarely shows the complete cost. Material grade, block size, extraction difficulty, and local availability can change the price sharply. A lower quarry price may also produce more waste during cutting. That difference matters.

Fabrication usually includes slab cutting, edge profiles, openings, polishing, and quality checks. Ask whether measurements, templates, packaging, and replacement pieces are included.

Finishing needs careful comparison too. Honed, leathered, brushed, and polished surfaces require different labor and equipment. Small samples can hide variation. Inspect full slabs whenever possible.

Freight adds more than distance. Crate size, port handling, insurance, customs charges, and delivery access all affect the landed cost. A remote site may need extra lifting equipment or staged delivery.

Installation quotes should identify substrate preparation, adhesives, seams, leveling, sealing, and cleanup.

Experienced installers also allow for site tolerances, because walls and floors are rarely perfect. I have seen budgets fail when installation was treated as a simple final step.

Compare every cost in one currency, with the same tax assumptions and measurement units. Request itemized quotations from the quarry, fabricator, carrier, and installer. Keep a realistic allowance for breakage and design changes. Even then, estimates remain imperfect. A missing detail can outweigh a seemingly attractive material price.

Normalize Quotes for 5–15% Cutting Waste and Slab Yield

Why Compare Stone Material Costs: A Global Buyers Guide?

A stone quote is not comparable until its yield is normalized. The Natural Stone Institute advises allowing approximately 5–15% for cutting, edge trimming, breakage, and layout changes.

A simple example shows why. A project needs 100 square meters of finished stone. With 10% cutting waste, the buyer must budget for about 111 square meters of raw material, not 100.

Yield matters.

USGS Mineral Commodity Summaries 2024 reports dimension stone by material category, including granite, limestone, sandstone, and slate. This classification matters because density, block size, and defect rates affect usable slab area.

Grand View Research’s 2024 market assessment also identifies construction and renovation as major demand drivers for natural stone. Yet market averages cannot replace project-level inspection. Color variation, fissures, vein direction, and bookmatching can reduce yield further. The estimate is never perfect.

Tips:

Ask every supplier for three figures: raw slab area, usable yield, and cutting allowance.

Compare the delivered cost per usable square meter.

Keep freight, thickness, surface finish, and inspection terms separate.

A low quoted price may hide poor yield.

I still see buyers miss this. A spreadsheet helps, but photographs and nesting plans reveal more.

Cite each assumption in the purchase file, then revise it after the first cutting batch.

Rank Suppliers by Cost, Lead Time, Certification, and Quality Risk

Stone price alone is a weak buying signal. A cheaper quote can hide longer transit, inconsistent thickness, or higher replacement risk. Rank suppliers across four practical fields: landed cost, lead time, certification, and quality risk. The lowest price should not automatically win.

Use a weighted scorecard before requesting samples. Give landed cost 35%, lead-time reliability 25%, certification 20%, and quality risk 20%. The World Bank’s Logistics Performance Index 2023 evaluates customs, infrastructure, tracking, and delivery timeliness. These factors directly affect imported stone schedules. McKinsey’s supply-chain research reported that 92% of surveyed companies changed their supply-chain footprint after recent disruptions. Location deserves real weight.

Certification needs verification, not polite promises. The ISO Survey 2022 recorded more than 1.2 million ISO 9001 certificates worldwide. That number shows broad adoption, but certification alone cannot confirm color consistency or surface performance. Request current certificates, quarry details, batch photos, inspection records, and independent test results. Compare delivered samples against approved samples under natural and artificial light. Small differences become expensive across a hotel wall.

No scorecard is perfect. That is the uncomfortable part. Port congestion, quarry changes, and seasonal production can damage a strong ranking. Recheck lead-time evidence every quarter, and keep a contingency supplier for critical projects. Cost still matters, but predictable quality usually protects the budget better.

Why Compare Stone Material Costs A Global Buyers Guide? — Rank Suppliers by Cost, Lead Time, Certification, and Quality Risk

Indicative 2025–2026 buyer benchmark for standard commercial orders of natural stone slabs or cut-to-size products. Costs are shown in USD per m² and represent typical FOB-to-CIF market ranges before local taxes, installation, duties, special packaging, and project-specific fabrication. Actual quotations vary by quarry, finish, thickness, volume, inspection requirements, and destination.

Overall Rank Source Region Material Category Typical Product Specification Indicative Export Cost
USD/m²
Typical Production & Shipping Lead Time Certification / Documentation Readiness Quality Risk Common Quality Issues to Verify Best-Fit Buyer Profile Buyer Score
Out of 100
1 Southern Europe Commercial marble 18–20 mm polished slabs; calibrated thickness; standard crate packing $55–$110 4–8 weeks production;
3–6 weeks ocean transit
CE documentation EN 13748 / EN 1469 support Technical datasheet Low to Medium Vein continuity, resin filling, shade variation, slab flatness, edge protection Projects requiring consistent documentation, architectural support, and stable finishing quality 86
2 East Asia Engineered quartz surface 20 mm or 30 mm slabs; polished finish; resin-based composite surface $38–$78 3–6 weeks production;
3–5 weeks ocean transit
Technical datasheet VOC report often available ASTM test support Medium Color consistency, resin discoloration, flatness, edge chipping, formulation compliance Large-volume residential and commercial projects prioritizing repeatability and price control 83
3 South Asia Granite 18–20 mm polished slabs; natural variation; reinforced export crating $28–$65 4–7 weeks production;
4–6 weeks ocean transit
ASTM test reports EN test reports Origin documents Medium Fissures, resin repair, water absorption, bundle shade mixing, polish uniformity Countertops, façades, paving, and projects able to accept natural color variation 81
4 East Asia Sintered stone / porcelain slab 6–12 mm large-format slabs; matte or polished finish; fragile-panel packaging $32–$85 5–9 weeks production;
3–5 weeks ocean transit
CE documentation Slip-resistance data Stain-resistance data Medium Internal tension, corner breakage, print repeat, calibration, handling damage High-performance wall, floor, kitchen, and exterior applications with qualified installers 79
5 Middle East and North Africa Limestone and travertine 20–30 mm tiles or slabs; honed, brushed, or tumbled finish $24–$58 4–8 weeks production;
3–6 weeks ocean transit
Petrographic report Water absorption data EN test support Medium Open pores, filling quality, fossil distribution, thickness tolerance, moisture sensitivity Hospitality, landscaping, façades, and interiors where natural texture is commercially acceptable 76
6 South America Premium quartzite 20 mm slabs; polished or leathered finish; selective block yield $75–$180 6–12 weeks production;
4–7 weeks ocean transit
Petrographic report Water absorption test Origin documentation Medium Natural fissures, resin stabilization, slab movement, vein matching, limited block availability Luxury residential, hospitality, and landmark projects requiring distinctive natural patterns 74
7 Eastern Europe and Central Asia Granite and hard limestone 20 mm slabs or cut-to-size pieces; polished, flamed, or honed finish $35–$90 5–10 weeks production;
3–6 weeks ocean or multimodal transit
EN test reports CE support where applicable Batch inspection records Medium Batch variation, fissures, surface pitting, dimensional tolerance, transport-related damage Regional construction, public works, façades, and medium-scale commercial projects 72
8 Southeast Asia Andesite, basalt, and volcanic stone 20–30 mm tiles, paving, or custom slabs; flamed, bush-hammered, or honed finish $26–$70 5–10 weeks production;
3–6 weeks ocean transit
Slip-resistance data Water absorption data Origin documents Medium Color range, surface texture, thickness variation, breakage, moisture absorption Outdoor paving, landscaping, pool surrounds, and high-slip-resistance applications 70
9 Mixed Emerging Supply Markets Low-cost marble and limestone 18–20 mm slabs or tiles; standard polished or honed finish $18–$45 4–9 weeks production;
4–7 weeks ocean transit
Basic technical datasheet Test reports vary Third-party inspection recommended Medium to High Unreported resin repair, mixed grades, inconsistent thickness, weak packaging, color sorting Cost-sensitive developments with strong incoming inspection and flexible appearance standards 64
10 Small-Batch or New Export Sources Specialty stone and unclassified natural materials Project-specific slabs or tiles; finish and thickness confirmed per order $30–$140 8–16 weeks production;
4–8 weeks transit
Documentation case-by-case Independent testing advisable Pre-shipment inspection essential High Unstable supply, block yield, inconsistent grading, incomplete test data, weak replacement capability Design-led projects where uniqueness matters more than repeatability, speed, or low procurement risk 58
Cost bands are indicative market ranges rather than fixed quotations. Lead time includes normal production and main ocean transit but excludes customs clearance, port congestion, inland delivery, and installation.
How to interpret the comparison: Rank suppliers using a weighted score that reflects project priorities. A practical model is: landed cost 35%, lead time 20%, certification and documentation 15%, quality consistency 20%, and supply continuity 10%. Before placing an order, request the same technical specification from every supplier, compare identical thickness and finish, approve physical samples, review batch photographs, confirm packaging standards, and use an independent pre-shipment inspection for high-value or large-volume orders.

FAQS

Why should stone prices be compared with performance data?

Price alone can hide moisture, strength, and installation risks. Test results show how stone may respond to water and pressure. They do not guarantee long-term durability.

What does water absorption indicate?

Water absorption measures how much moisture a stone can take in. Lower absorption may support exterior applications. Climate, detailing, and workmanship still matter.

Does higher compressive strength always mean safer stone?

No. A 120 MPa result is not automatically safer than 90 MPa. Thickness, design loads, anchoring, climate, and installation affect performance.

What documents should buyers request?

Request recent laboratory reports, not only quarry datasheets. Check absorption, strength, sample age, specimen direction, and testing conditions. Some comparisons remain imperfect.

Which costs belong in a complete stone budget?

Include quarrying, cutting, finishing, packaging, freight, taxes, installation, and cleanup. Add allowances for breakage and design changes. Small omissions become expensive.

Why can a low quarry price create higher costs?

Difficult cutting may produce more waste. Block size, material grade, extraction difficulty, and local supply also change final costs. Cheap material is not always cheap.

What should fabrication quotations clearly include?

Confirm cutting, edge profiles, openings, polishing, templates, packaging, and replacement pieces. Finishes need different labor and equipment. Small samples can hide slab variation.

How can freight and installation costs change the decision?

Crate size, port handling, insurance, customs, and delivery access affect landed cost. Remote sites may need lifting equipment or staged delivery. Walls and floors are rarely perfect.

How should different quotations be compared?

Use one currency, matching tax assumptions, and consistent measurement units. Request itemized quotes from every supplier. I would not trust a “complete” quote without checking the details.

Conclusion

The Stone Material Cost Comparison Guide provides a practical framework for evaluating the true delivered cost of 20–30 mm stone slabs across international markets. Rather than comparing quotations by material price alone, it combines quarrying, fabrication, surface finishing, freight, handling, and installation expenses into a clear cost-per-square-meter calculation. It also adjusts estimates for typical cutting waste of 5–15% and considers slab yield, helping buyers understand how much usable material each order will provide.

To support reliable purchasing decisions, the guide recommends classifying stone using ASTM C97, ASTM C170, and EN 1469 performance data, including absorption, strength, and suitability for the intended application. Suppliers can then be ranked according to total cost, lead time, certification, consistency, and quality risk. This approach creates a balanced comparison that reveals hidden expenses, improves budgeting accuracy, and helps buyers select dependable stone sources based on measurable value rather than headline pricing.

Amelia

Amelia

Amelia is a seasoned marketing professional with a wealth of expertise in our company’s core offerings. With an unwavering passion for driving growth and innovation, she plays a pivotal role in shaping our marketing strategies and enhancing brand visibility. A key aspect of her responsibilities......